
Features & Specifications
Our core technologies consist of the following three engines, corresponding to the three distinct stages of the “sense-analyze-react” cycle of closed-loop analytics.
Location Tracking Platform
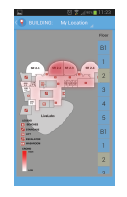 Tracks the indoor location and movement of users via any standard Wi-Fi infrastructure (without requiring any software installation on consumer mobile devices). This engine implements special code to continually retrieve wireless signal measurements captured by the Wi-Fi infrastructure (consisting of Wi-Fi APs and controllers), and then applies advanced and proprietary statistical techniques to simultaneously infer the location of hundreds-to-thousands of devices. The platform also provides tools for visualization (e.g., real-time Heatmaps).
Mobile Analytics Platform
Implements novel analytics techniques that operate on the location data (as well as any other additionally
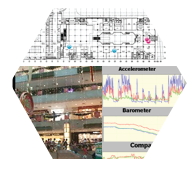
available mobile sensing data) to derive advanced insights. Examples of implemented components include:
(i) Location Prediction Engine, that utilizes past movement data to predict the future movement paths of individuals;
(ii) Group Detection Engine, that applies advanced correlation techniques on the underlying noisy movement traces to separate visitors into individuals vs. groups;
(iii) Queuing Analytics Engine, that utilizes the inertial sensing data from customer’s mobile devices to deduce individual-level queuing behavior, and the waiting and service times of different queues.
Behavioral Experimentation Platform
Allows the venue operators and retailers to easily conduct context-driven customer engagement trials.

This platform offers a portal-based interface that
(a) Allows experimenters to create “advanced experiments”, specifying for example both static and dynamic attributes of users that should be targeted (e.g., deliver this promotion only to “male users, who have already visited at least 3 stores and have now been queuing for at least 8 minutes”),
(b) Automates the deployment and execution of such experiments (e.g., single or multi-treatment trials) and
(c) Summarizes the results and experimental outcomes via customizable graphs, charts, etc.
Last updated on 08 Apr 2016 .